
Premier League 2018 Summer Transfer Window: The Numbers
The 2018 summer transfer window was a trickier market than usual Premier League clubs to manoeuvre in. Pressure from truncated deadlines, World Cup distractions and evaporating domestic TV money all combined to put the squeeze on English clubs, who were forced to wade through ever deepening complications to sign their new footballers.
The shift in market dynamics was noticeable and though Premier League clubs again passed the billion-pound mark in total spend, it was the first time in six years that we saw a regression in the overall transfer splurge figure.
Read More: Premier League 2018/19 Outright Betting Tips and Predictions – Winner and Top 4
| Year | 2018 | 2017 | 2016 | 2015 | 2014 |
| Total Spend | £1.24b | £1.47b | £1.194b | £870m | £835m |
Premier League clubs spent a whopping £1.24b between them on transfers this summer, and though the figure is still undoubtedly colossal, the drop of approximately £230m in spend from the same time last year could represent the start of a downward trend in Premier League transfer outlay.
The Premier League’s decision to close the transfer window before the start of the 2018/19 domestic season undoubtedly had a sizeable impact on final spend, though the 20 top flight clubs must have also had an eye on the competition’s latest TV deal negotiations.
At the start of the year, the Premier League’s TV rights domestic contract auction couldn’t match the financial high points hit by previous deals. The 2016-2019 TV agreement earned the EPL £5.14b, though the latest auction secured a reduced £4.464b pay-out for 2019-2022 coverage, a significant 12.5% drop.
An increase in foreign TV revenue has helped to compensate for the shortfall in TV cash, but nevertheless, any sign that the domestic market has reached a plateau or even a tipping point has got to have money men stuffing mattresses.
Even with emerging markets and new streaming platforms playing bigger broadcasting roles, the drop in the bread and butter domestic TV income could have Premier League clubs gearing up for a collective tightening of belts.
Of course, there is also a Brexit shaped shadow looming on the horizon, stretching its misty tentacles ever closer…..
Where are the new signings coming from?
| 2018 | 2017 | 2016 | 2015 | 2014 | |
| Intra-Premier League transfers | 23 | 49 | 50 | 47 | 59 |
| Lower League | 26 | 27 | 24 | 27 | 31 |
| La Liga | 18 | 9 | 18 | 11 | 17 |
| Serie A | 7 | 7 | 6 | 13 | 8 |
| Bundesliga | 14 | 14 | 11 | 12 | 3 |
| Ligue 1 | 14 | 9 | 11 | 17 | 8 |
| Other | 27 | 30 | 30 | 34 | 39 |
| Total | 129 | 145 | 150 | 161 | 165 |
Read More: FST’s Deadline Day Confirmed Premier League Transfers List
The 2018 summer transfer window also saw a huge drop in Premier League intra-club transfers. Having averaged around 51 EPL player switches in the four summers between 2014 and 2017, the number of players moving between Premier League clubs dropped to 23 in 2018.
Again, the shortened transfer window has had a noticeable impact, but when teams are quoted £65m for the likes of Harry Maguire and £75m for Wilfried Zaha, it’s easy to see why Premier League clubs have chosen to shop elsewhere.
Signings from the English lower leagues have remained virtually constant over the past 5 summers, with a steady stream of talent rising to the surface from the lower reaches of the domestic pyramid.
Players from La Liga and Ligue 1 look to have filled the gaps vacated by the glacial intra-club Premier League market, with a 100% and 55% increase in imports arriving from those leagues this summer respectively.
Bundesliga has become a more fertile hunting ground for Premier League clubs over the past 5 years, replacing what looks a consistently depreciating Serie A talent pool.
Interestingly, just 1 player from Scotland has moved south to the Premiership in each of the last 3 summers, suggesting an ever-widening gap in quality between the cross-border neighbouring leagues.
Most popular positions
| 2018 | 2017 | 2016 | 2015 | 2014 | |
| Goalkeepers | 22 | 18 | 19 | 19 | 15 |
| Defenders | 40 | 48 | 44 | 47 | 57 |
| Midfielders | 51 | 51 | 55 | 60 | 56 |
| Forwards | 16 | 28 | 32 | 35 | 37 |
| Total | 129 | 145 | 150 | 161 | 165 |
Read More: Premier League Expected Goals (xG) – Who Were the Winners and Losers Last Season?
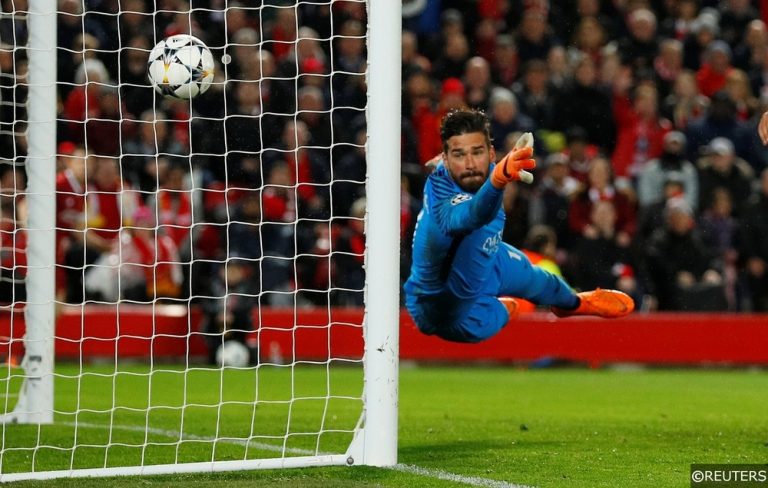
This summer, first Liverpool and then Chelsea smashed through the world record fee barrier to sign goalkeepers Alisson Becker and Kepa Arrizabalaga for a combined £133m. The spend on those two keepers alone accounted for nearly 11% of the total Premier League outlay in this window.
Those signings helped to boost the number of goalkeepers signed by Premier League clubs to its highest figure inside 5 years.
Elsewhere, the forwards transfer statistics are interesting – it’s a common theme in football debate and conversation to lament the lack of genuine top-level centre forwards. This summer’s business suggests that Premier League clubs are also struggling to identify players to lead the line.
Just 16 forwards were transferred to or between Premier League clubs, a 42% drop on last year’s figure. There had been a gradual decline in new forwards at Premiership clubs in the 4 years before that, though this year’s fall in attacking transfers is particularly eye-catching.
Possession remains the name of the game for most and midfielders have remained by far and away the most popular position to sign for Premier League managers of the past 5 years. In fact, 36.4% of all players who have found new Premier League employers in the last 5 years have been midfielders.
In terms of total players signed, this summer’s figure of 129 is an 11% drop in the total number of players that were brought in last year and a huge 21.8% drop transfer movement compared to 2014.
In fact, the total number of incoming and inter-club Premier League transfers has been reducing year on year since 2014, even though, before this summer, the total spend had been climbing at a staggering rate.
Shopping locally
| 2018 | 2017 | 2016 | 2015 | 2014 | |
| Intra-Premier League transfers | 23 | 49 | 50 | 47 | 59 |
| Lower League | 26 | 27 | 24 | 27 | 31 |
| Total | 49 | 76 | 74 | 74 | 90 |
| % of total transfers from | 37.98% | 52.41% | 49.33% | 45.96% | 54.54% |
| English clubs to Premiership clubs | |||||
The number of intra-English club transfers (i.e. the number of incoming Premier League signings from other English clubs, including lower division players) has also taken a significant drop this year.
The reduction in moves between Premier League clubs accounts for much of the dip, but it’s still interesting to note that just 37.98% of Premiership 2018 summer signings were brought in from other English clubs compared to 52.41% last year and a 5-year high of 54.54% in 2014.
The future
It could transpire that some less active Premier League clubs play “catch-up” in the winter transfer window to drag the overall spend for the season up to normal levels, but of course large amounts of movement at the time of year would be unusual.
With the ramp-up in financial uncertainty in the UK expected to climb as we approach the middle of next year, it makes more sense to forecast a continued downward trend in Premier League spending at least in the medium term.
Most will welcome a return to something like normality after the staggering spike in fees and wages over the past half a decade, though pulling the financial rug out from under Premier League clubs would leave many of the middle to lower ranking teams burdened by squads packed full of players on peak wages.
Whichever angle you approach it from, it looks as though Premier League club accountants will be working plenty of overtime over the next 12 months.
Follow Free Super Tips on Twitter to stay up to date with our daily tips and predictions or browse more football content on our website: